Tools Gard — Meta Ads for a Pakistani power-tools store
Meta Ads for Tools Gard, a Pakistani online store for power tools from Makita, DeWALT, Bosch and Forward. In June 2026 the account returned 16.89× on ad spend. In July we pushed for reach: 70% more people, 34% more Meta purchases and 28% more Shopify orders, at a ROAS of 9.23×. Here is what that trade looked like.
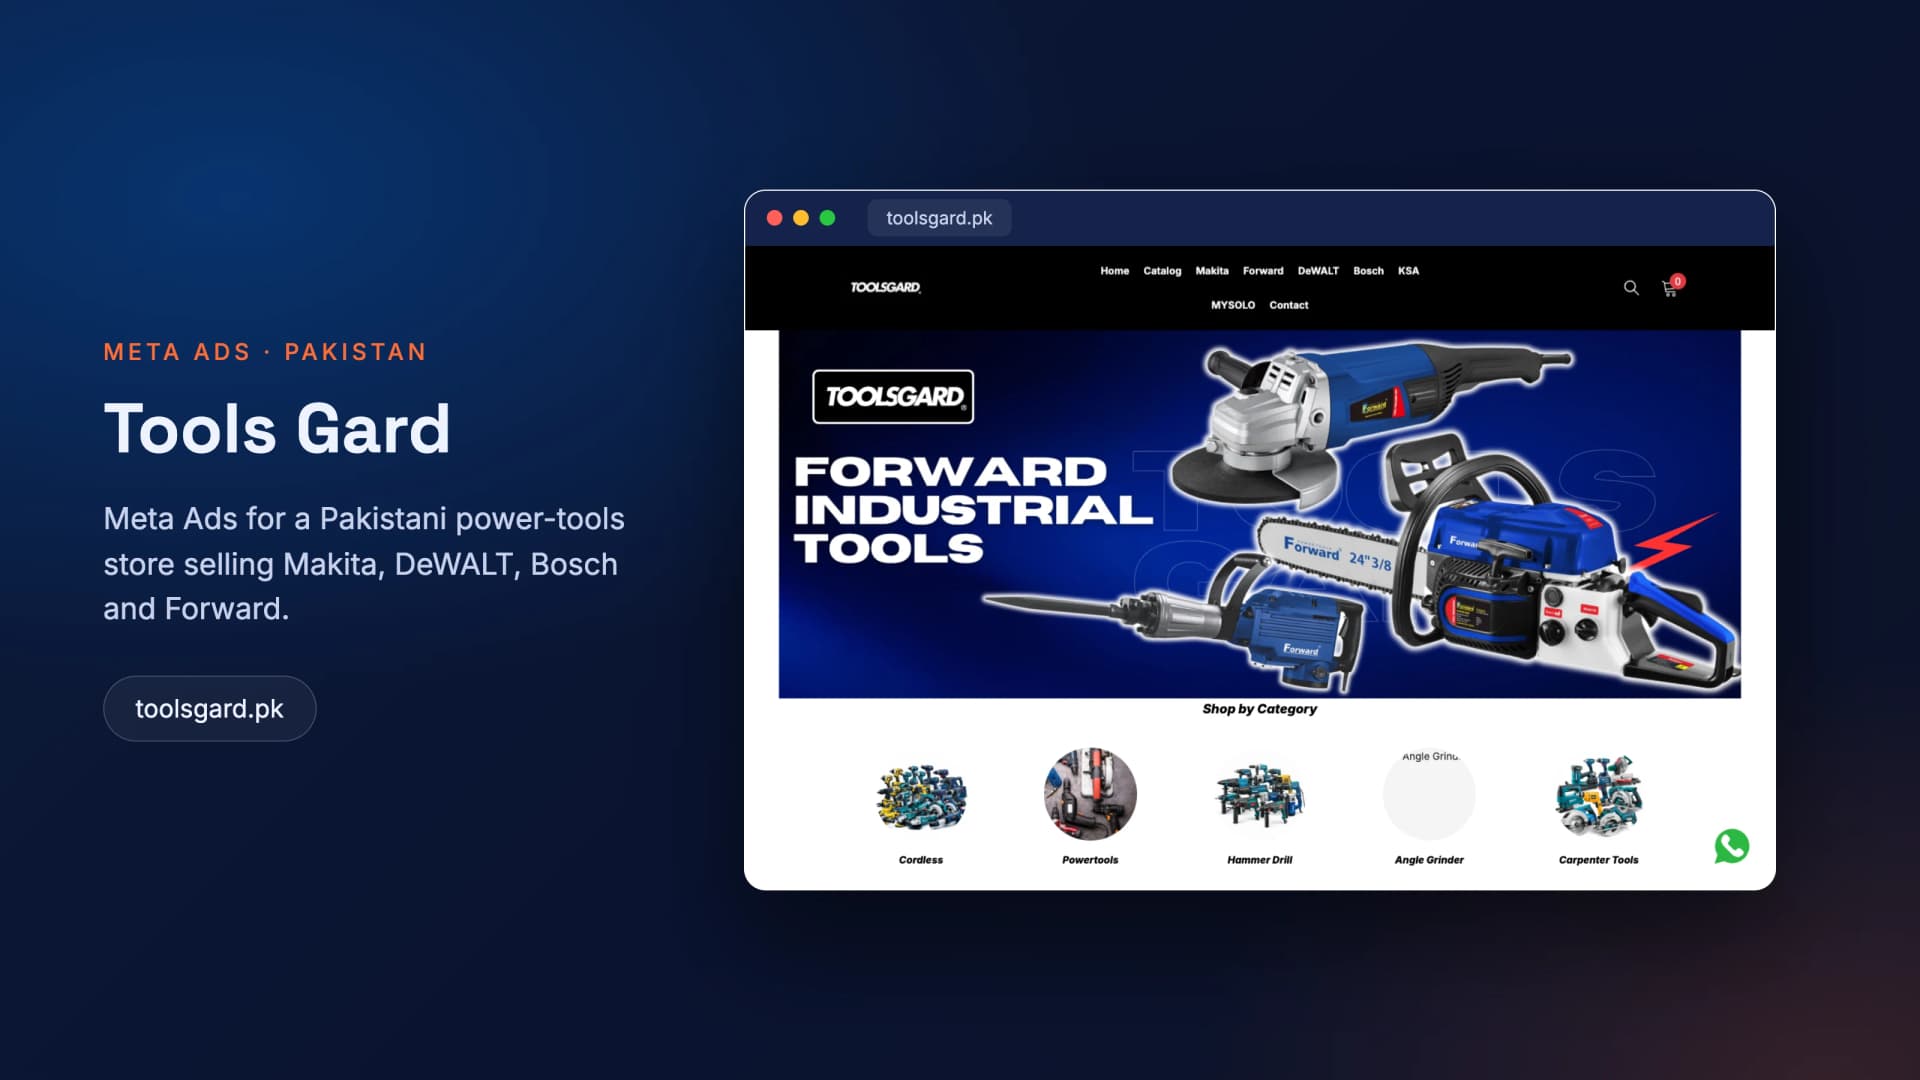
Source: Meta Ads Manager + Shopify · June–July 2026
01 The challenge
A profitable account being asked to scale: how much more reach can it buy before each rupee returns less?
Power tools are a considered purchase. A contractor or a serious DIY buyer comparing a Makita grinder with a Forward one wants to see the specific model, the price and whether the store is real before paying, and in Pakistan most of those buyers find out about a store on Facebook and Instagram, not on Google. For Tools Gard, Meta is the main way new customers arrive.
The account was already profitable. The question for the summer was the one every store eventually faces with a profitable account: how much more can it spend before each rupee starts returning less? Scaling Meta Ads is not free. Wider audiences are cheaper to reach but less ready to buy, and the more of them the ads find, the harder it is to hold the return of a small, tightly targeted account.
02 What we did
June was the efficient month. Campaigns reached 1.08 million people, drew 92,373 link clicks at a 3.37% click-through rate and produced 639 purchases that Meta attributes to the ads, returning 16.89 times what was spent. The Shopify backend recorded 716 orders for the month.
In July we scaled. Spend went up by about a third, and reach rose 70% to 1.84 million people, impressions 61% to 4.42 million, and link clicks 43% to 131,794. Meta-attributed purchases rose 34% to 858, and Shopify orders rose 28% to 916. On volume, every number moved the right way.
The return moved the other way, and we are showing it rather than leaving it at the June figure. ROAS fell from 16.89 to 9.23. Two things drove that. Click-through rate eased from 3.37% to 2.98%, which is what happens when ads reach a wider, cooler audience. And although there were more orders, they were smaller: the attributed sales value fell even as the number of purchases rose, so July's average order was worth markedly less than June's. More people bought, but more of them bought the smaller items.
A 9.23× return is still a strongly profitable account, and the store came out of July with more customers than it went in with. The next step is to keep the new reach and win back the order value: product-led creative for the higher-ticket tools, audiences built from June's buyers, and separate budgets for the big-ticket and accessory ranges so that one cannot quietly absorb the other.
03 The numbers
What scaling bought.
July against June, from Meta Ads Manager and the Shopify backend.
Key metrics
Shopify orders · June vs July 2026
July 2026 · Meta Ads to Shopify
- Impressions4.42M
- People reached1.84M
- Link clicks131,794
- Shopify orders916
More grow work.
All case studies →
Profitable, but stuck at this spend?
Free 30-minute call — we'll read your Meta account and show you where the next rupee should go.
Trusted by teams like yours





The service behind this project
Need the same work?
Meta Ads Management for UK Businesses
A Meta Ads agency UK brands get creative volume from: production included in a flat fee, no percentage of media, reporting against measured…
Shopify Development for US Merchants
A Shopify development agency USA merchants can verify: an American made-to-order store carrying 675 products and 10,784 variants, launched…
Meta Ads Management in Pakistan
A Meta Ads agency in Pakistan optimising on delivered orders rather than placed ones. Your Business Manager, your pixel, management fee…